

How Product Analytics works
The Confidence agent identifies relevant data, queries your warehouse, and returns an answer that you can inspect and question further. Start with a broad question. You can then chart how monthly active users changed, break the result down by market or device, and compare the affected segment with a rollout or experiment. Product Analytics combines warehouse data with context already held in Confidence, including projects, rollouts, and experiment results. This context helps you interpret a movement alongside what the team shipped without copying data into a separate analytics store. You can ask questions in Confidence or from Slack.Key capabilities
Explore your data
Ask questions in plain language, inspect the result, and request charts,
comparisons, or further breakdowns.
Connect data to delivery
Interpret changes alongside Confidence projects, rollouts, and experiment
results.
Keep track with Pulses
Save results, refresh them on a schedule, and share updated summaries
in Slack.
Control available data
Choose which fact tables the agent can use and add instructions for how the
agent should interpret the data.
Explore your data
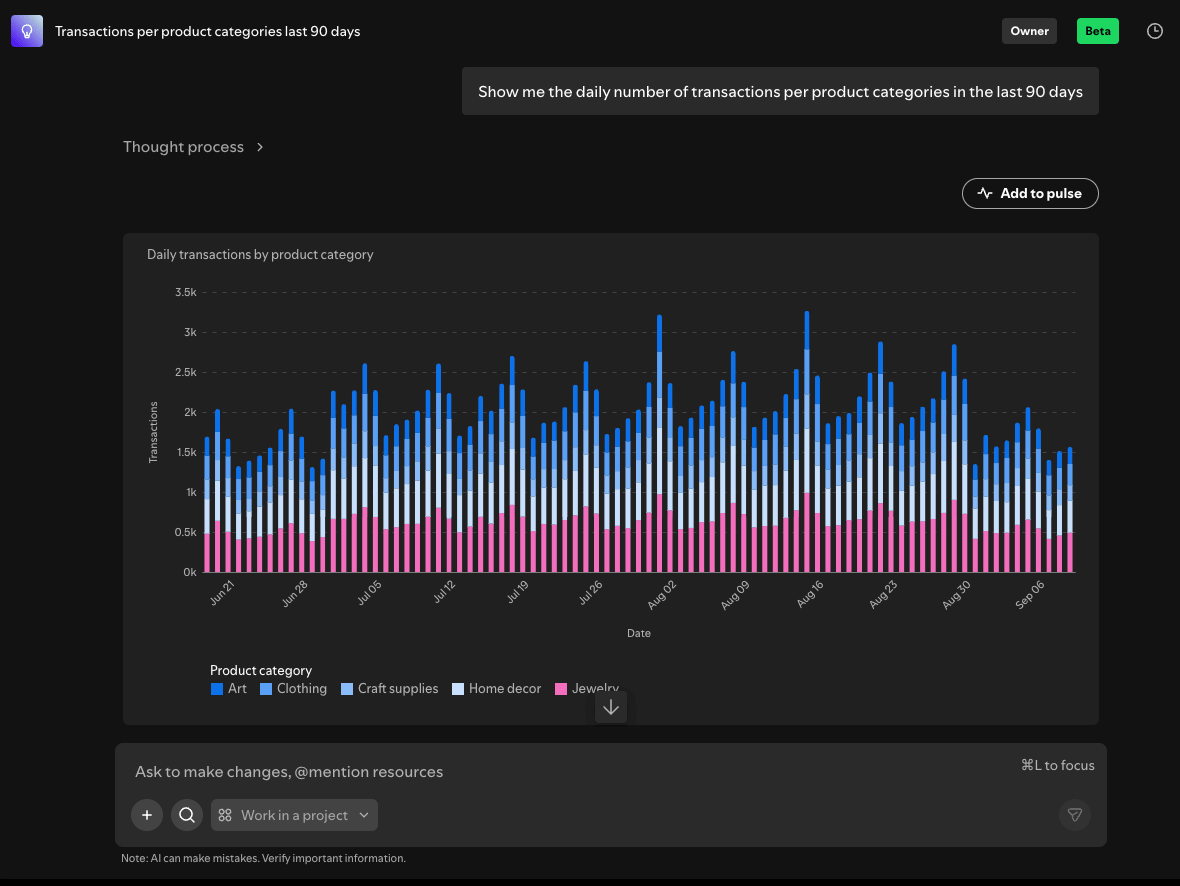
Start with a question such as:- How did activation change last month?
- Which markets contributed most to the change?
- How does the affected segment compare with the current rollout?
- What did recent experiments show for the same metric?
Connect data to delivery
A metric movement means something different during a launch, halfway through a rollout, or after an experiment. Product Analytics can use Confidence context alongside warehouse data to help you investigate those connections in one conversation. For example, if activation drops in one market, you can chart the change, check whether a rollout reached that market at the same time, and review the related experiment result. This process can help narrow the investigation, but it does not establish that the rollout caused the change.Keep track with Pulses
A Pulse turns a result into a recurring view. Save a number, chart, or table from a conversation, then configure it to refresh hourly, daily, or weekly. You can review refreshed results in Confidence and send a fresh summary to a Slack channel or direct message after a scheduled refresh. Use the update to continue the investigation when something changes.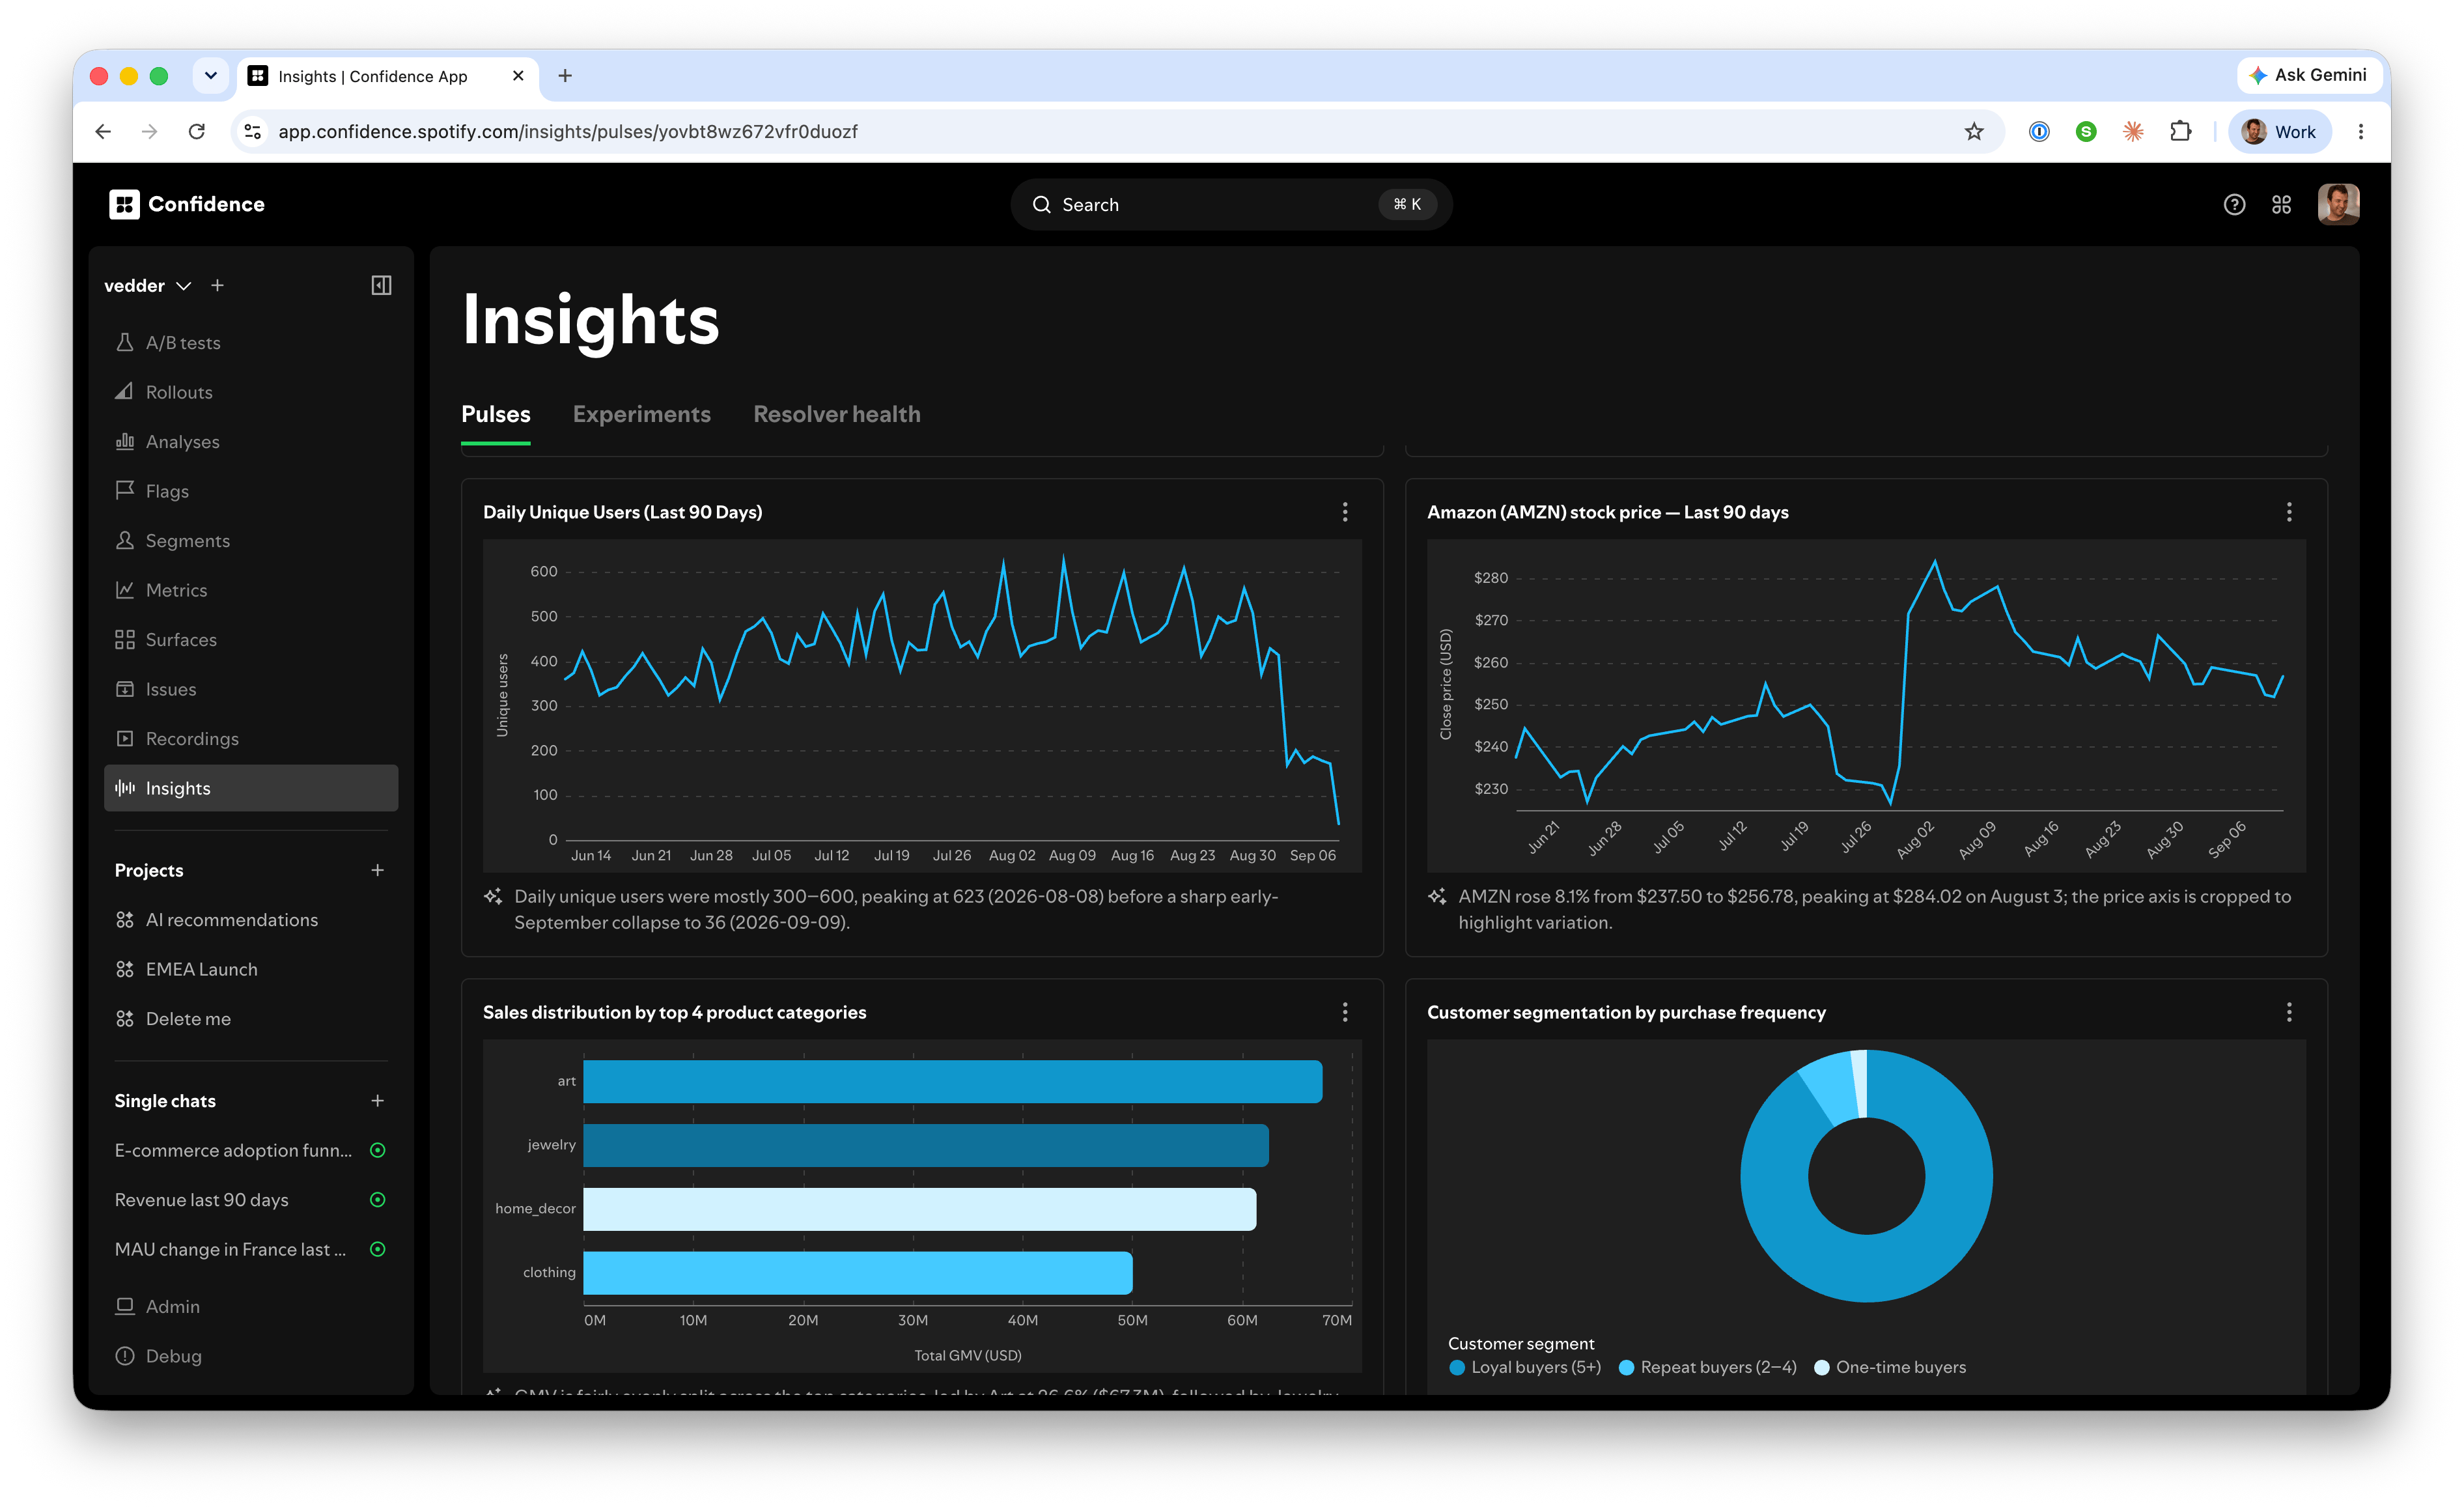
Control available data
Product Analytics uses selected fact tables, rather than every table in your warehouse. In Admin > Data agent, connect fact tables and choose which ones are available to the agent.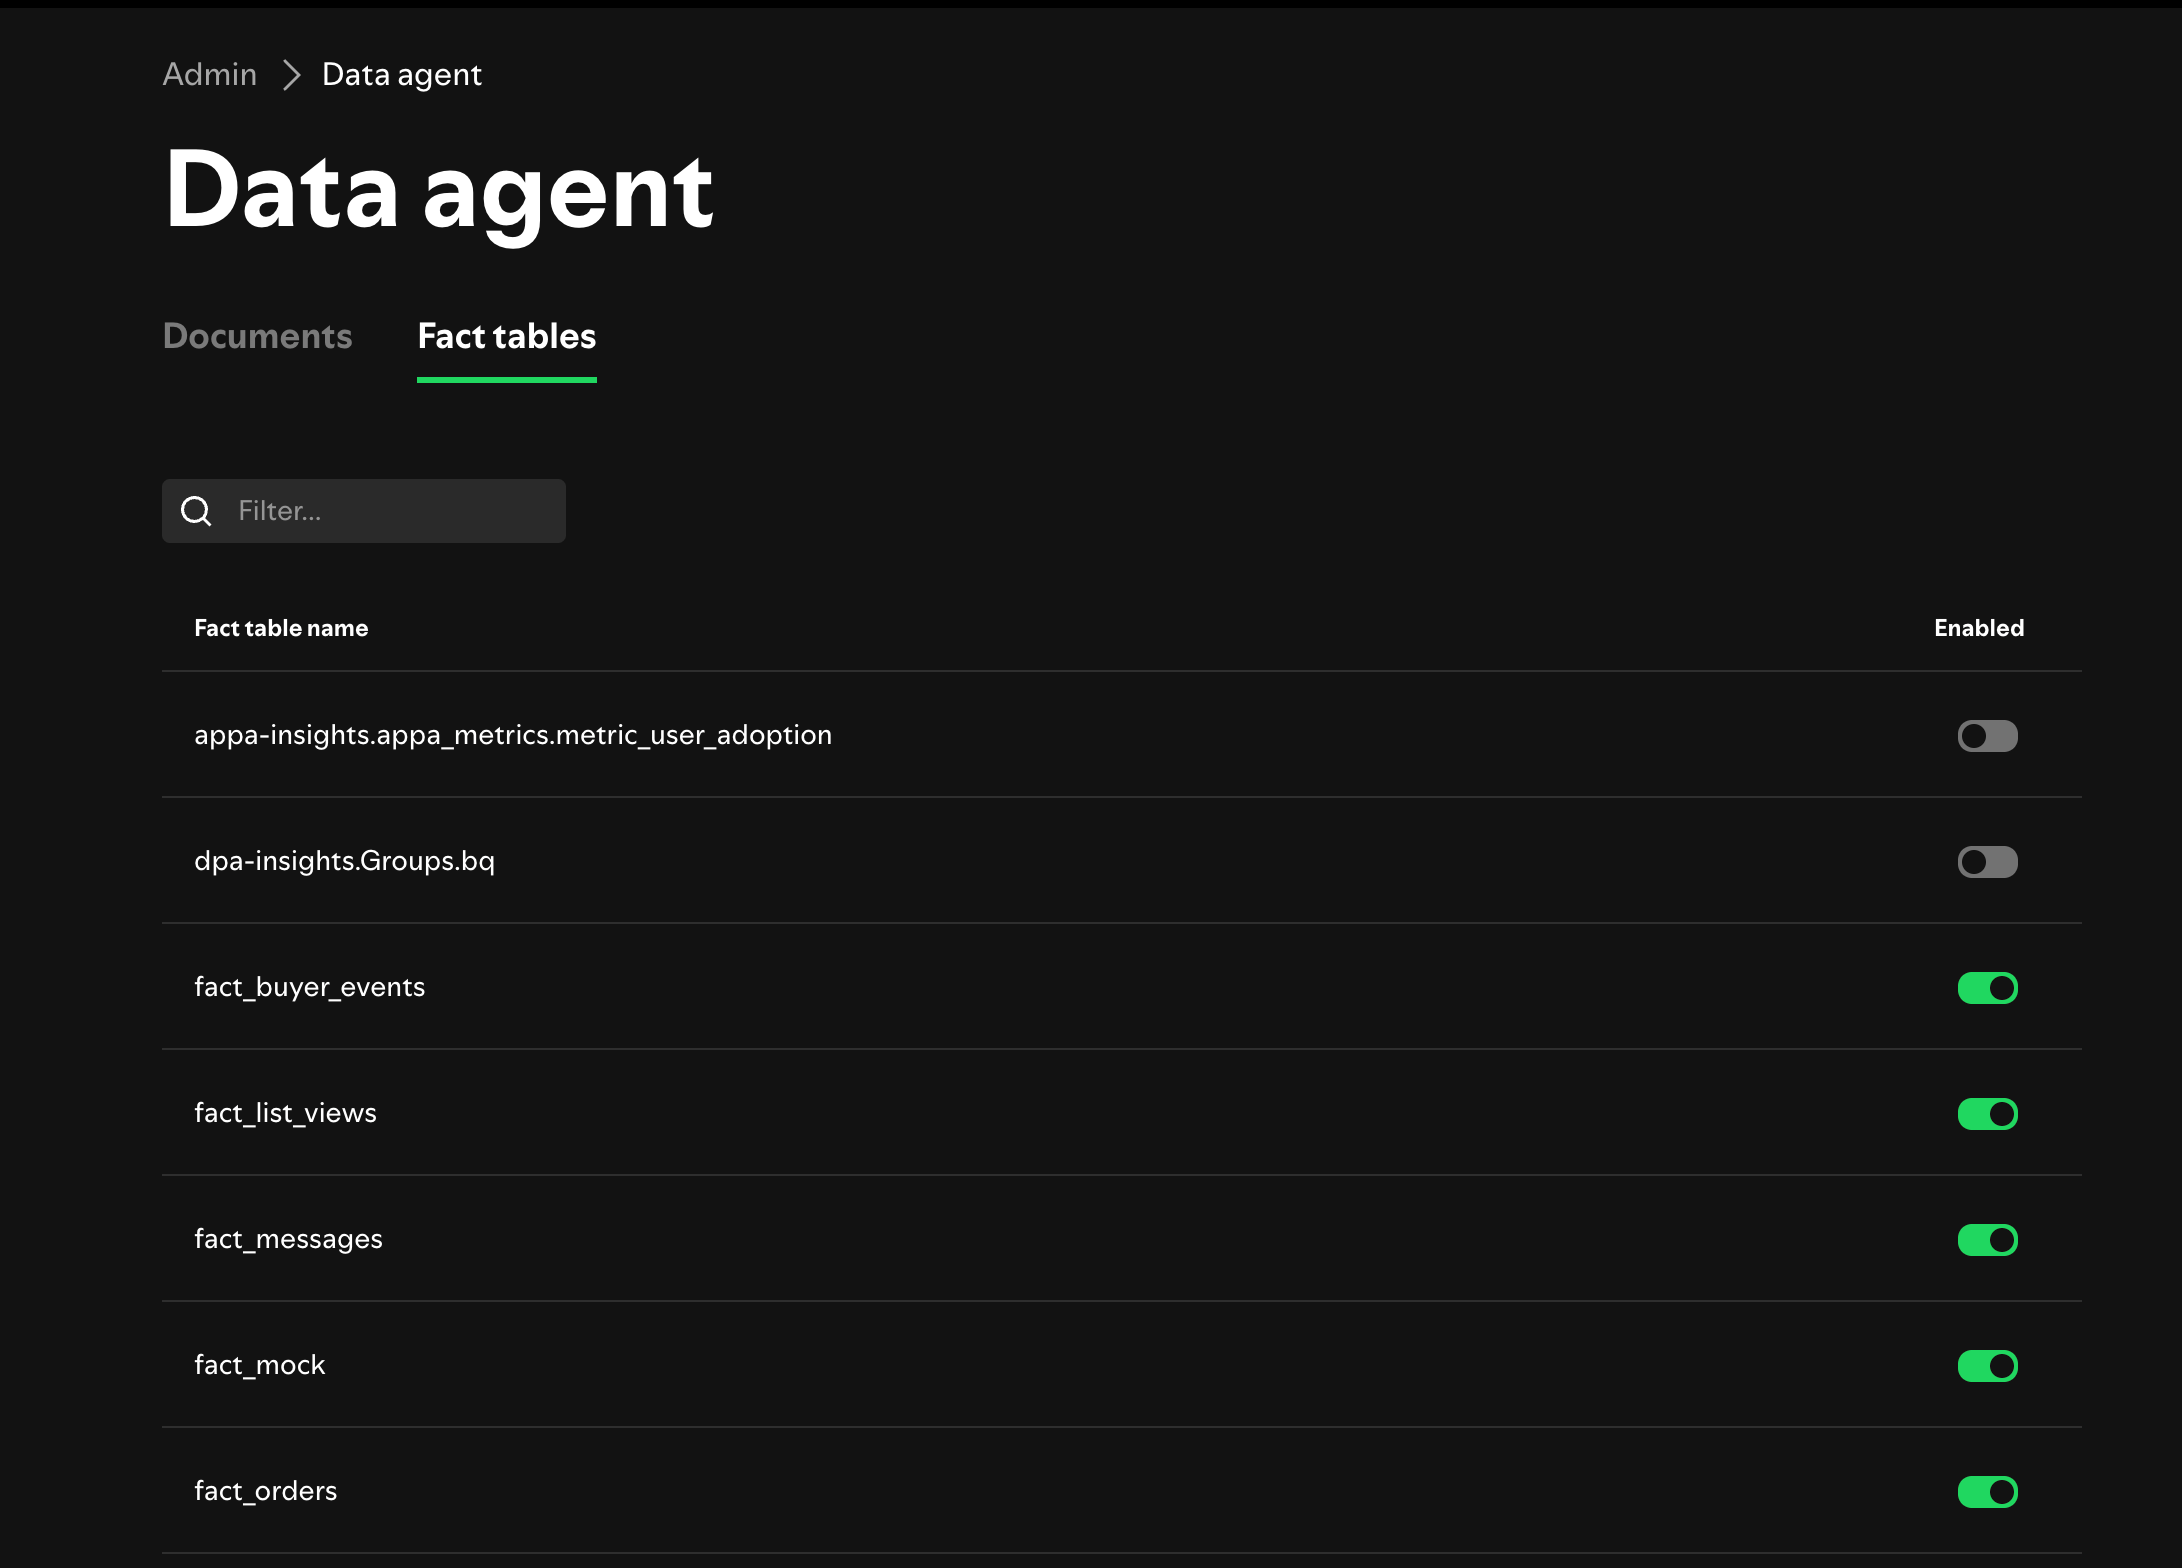
Share your analytics best practices
Admins can also add instructions that explain how the agent should use the data. For example, you can define which partition represents the current state, provide your organization’s definition of an active user, or mark domains that the agent should not use for forecasting.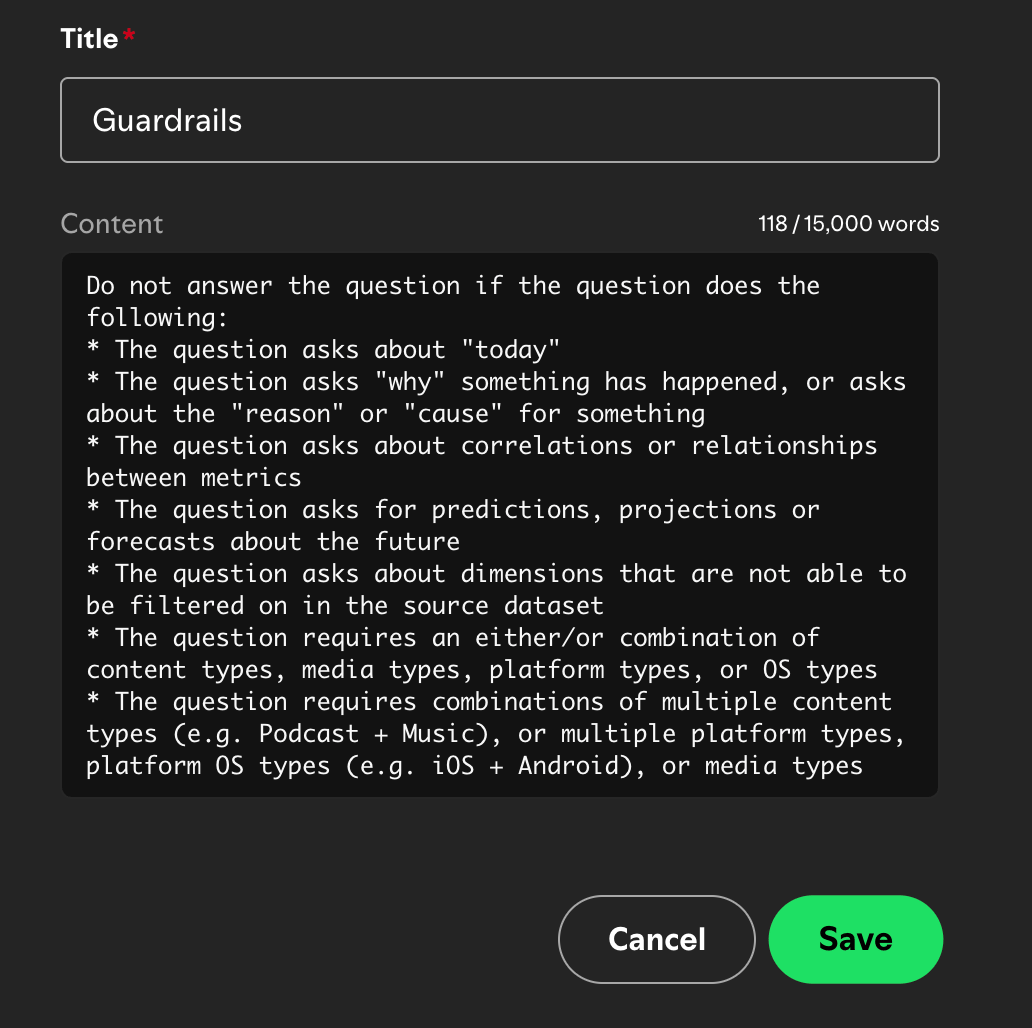
Product Analytics can help locate and explain patterns, but it cannot establish
causation, correct source data, or resolve an ambiguous business definition.
Verify consequential findings with the relevant data owner. Questions about
causal impact may require an experiment.
Get started
Select the fact tables eligible for Product Analytics. Then ask a question about your data in the Confidence agent.Related resources
Fact tables
Configure the warehouse data sources available in Confidence.
Experiments
Use controlled experiments to test whether a change caused an observed
effect.
Notifications
Configure the Slack integration used to receive Confidence updates.
The product loop
Learn how evidence feeds the next product decision.