> ## Documentation Index
> Fetch the complete documentation index at: https://confidence.spotify.com/llms.txt
> Use this file to discover all available pages before exploring further.
# Variance Reduction (CUPED)
> Use pre-exposure data to reduce the variance and increase your velocity.
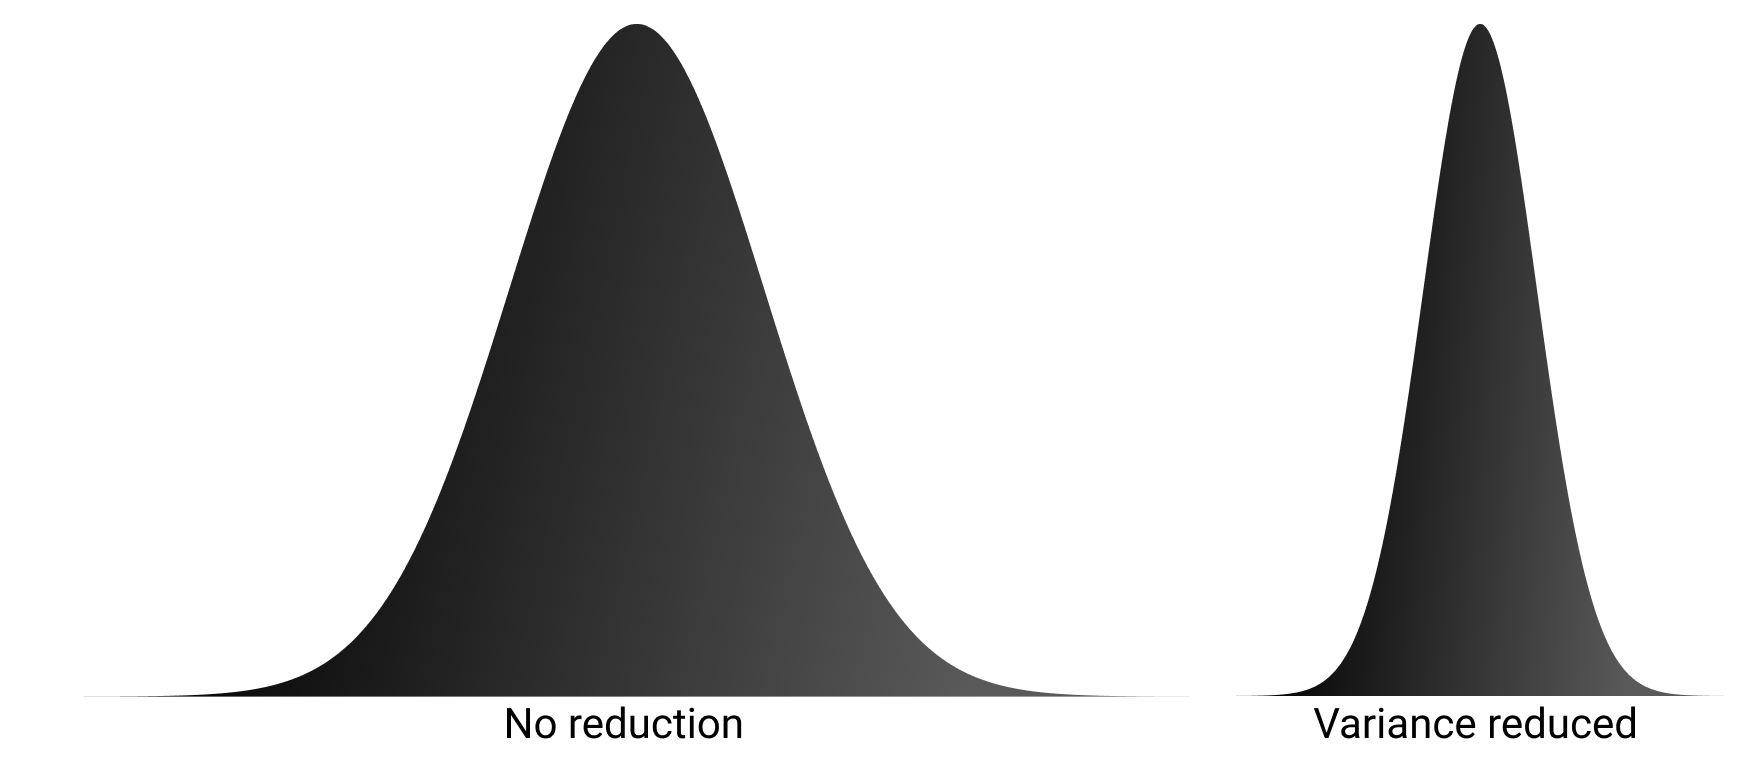
The variance of your metric plays an important role when analyzing an experiment.
With a higher variance, you require more samples to separate the signal from the noise.
A common approach to reduce the variance of a metric is to predict the current measurement using earlier measurements.
If the earlier measurements come from before the start of the experiment, they can adjust for individual variation
that the treatment itself doesn't affect.
Confidence lets you use historical metric values to reduce the variance.
 Statistical comparisons, like when comparing metric outcomes between two or more
groups in an experiment, are uncertain. Statistical theory
describes this uncertainty so that it's possible to
conclude that one treatment was superior to another. A standard
comparison of means overlooks the fact that, typically, a large chunk of the
variation in the means is in fact predictable. Consider an experiment on users,
where the metric of interest is time spent in the app. Across users, the amount
of time spent in the app over consecutive weeks is usually fairly highly correlated.
This means that a user who spends three hours a day in the app this week is
likely to spend a sizable amount of time in the app next week as well.
Experimental studies often apply covariate or regression adjustment to reduce the variance
and increase the precision.
Deng et al (2013) popularized covariate adjustment in online experimentation.
Their method is commonly referred to as CUPED.
For the adjustment approach to be valid, the experiment must not influence the data used for the adjustment.
In online experimentation, such data is often available.
Any data computed before the unit (such as a customer) entered the experiment is valid.
The more strongly the pre-exposure data correlates with the post-exposure outcomes, the larger the reduction in variance.
## Variance Reduction for Comparisons of Means
The variance reduction method implemented in Confidence for comparisons of means is the "full
regression adjustment" estimator discussed by Negi and Wooldridge (2021).
The method is more precise than the original CUPED approach. Negi and Wooldridge propose to:
* Regress $Y$ on $1, X$ separately for treatment and control, where $Y$ is the outcome, and $X$ is the pre-treatment variable.
* Estimate the treatment difference by $\hat{\Delta}_{VR} = (\bar{Y}_1-\bar{Y}_0)+(\bar{X}-\bar{X}_1)\hat{\beta}_1-(\bar{X}-\bar{X}_0)\hat{\beta}_0$,
where $\hat{\beta}_i$ is the estimated slope from the regressions, $\bar{X}_i$ and $\bar{Y}_i$ are the sample means for each group, and $\bar{X}$
is the overall sample mean of $X$.
Confidence reports both the adjusted and unadjusted estimates of the sample
means. The variance-reduced adjusted estimate is
$\bar{Y}_i-\hat{\beta}_i(\bar{X}_i-\bar{X})$ for each group $i$, and the
unadjusted estimate is $\bar{Y}_i$.
In experiments with multiple treatment groups, the control group's
variance-reduced adjusted mean estimate differs between comparisons. This
happens because the overall sample mean of the pre-treatment variable,
$\bar{X}$, uses only the data from the groups involved in the specific
comparison. Depending on which treatment group you are comparing to the control
group, $\bar{X}$ changes. Regardless, the variance-reduced treatment effect
estimate $\hat{\Delta}_{VR}$ is generally a more precise estimate than the
unadjusted estimate, providing a more reliable measure of the treatment's impact
on the metric of interest.
## Variance Reduction for Comparisons of Ratios
The approach for reducing the variance through use of pre-exposure data
resembles the method described in the earlier section when the metric of
interest is a ratio metric. Confidence uses the method described by Jin and Ba
(2023). Let $Y_i$ and $Z_i$ be the values for the numerator and denominator for
unit $i$. For example, $Y_i$ could be the total number of searches for user $i$,
and $Z_i$ their number of sessions. The ratio of interest is the group-level
ratio $\sum_{i=1}^n Y_i/\sum_{i=1}^nZ_i$. A difference in ratios between the
groups estimates the treatment effect:
$$
\hat{\Delta} = \frac{\sum_{i\text { in treatment}}Y_i}{\sum_{i\text { in treatment}}Z_i} - \frac{\sum_{i\text { in control}}Y_i}{\sum_{i\text { in control}}Z_i}
$$
To reduce the variance, Confidence applies regression adjustment separately to
each of the four terms in the expression. Ultimately, this leads to adjusted
estimates of the ratios in the two groups and a new estimate of the treatment
effect. The adjustment reduces the variance of the ratios of the two groups, and
the uncertainty surrounding the treatment effect is lower.
## Variance Reduction Rate
Variance reduction adjusts the comparison and reduces the variance as a result.
Ultimately, the variance reduction rate summarizes the size of the reduction:
$$
\text{Variance reduction rate} = 1 - \frac{\text{variance with variance reduction}}{\text{variance without variance reduction}}.
$$
## Relative Values
When using variance reduction, reported relative values use the unadjusted
estimates in the denominator. For a comparison of means, the reported relative
value is $\hat{\Delta}_{VR}/\bar{Y}_0$.
## Interpret Results with Variance Reduction
Interpret the reported treatment effect for a metric that uses variance
reduction in the same way as for a metric that doesn't. The pre-exposure data
helps produce a better signal of the treatment effect. Because the
variance-reduced treatment effect differs from the unadjusted treatment effect,
it can occasionally lead to a different conclusion than the unadjusted effect.
## Use Variance Reduction
Confidence enables variance reduction by default.
To turn on variance reduction for a metric:
1. Go to Confidence and select **Metrics** on the left sidebar.
2. Select the metric you want to enable variance reduction for and click **Edit metric**, or [create a new metric](../metrics#create-a-metric).
3. Expand **Advanced options**.
4. Ensure that **Variance reduction** is checked.
5. Optional. Select an aggregation window for the pre-exposure data.
The metric uses the same measurement, but before exposure, to reduce the variance. Variance reduction is accounted for
in the required sample size calculation by relying on historical patterns of how much the variance can be reduced.
To configure variance reduction via the API, see [Configure Variance Reduction](/docs/api/how-to-guides/stats/configure-variance-reduction).
## References
* A. Deng, Y. Xu, R. Kohavi and T. Walker (2013) "Improving the sensitivity of online controlled
experiments by utilizing pre-experiment data," WSDM '13: Proceedings of the sixth ACM international
conference on Web search and data mining.
* Y. Jin and S. Ba (2023) "Toward Optimal Variance Reduction in Online Controlled Experiments."
Technometrics.
* A. Negi and J. M. Wooldridge (2021) "Revisiting regression adjustment in
experiments with heterogeneous treatment effects", Econometric Reviews.
## Related Resources
Configure variance reduction settings
Understand test types
Configure experiment parameters
Statistical comparisons, like when comparing metric outcomes between two or more
groups in an experiment, are uncertain. Statistical theory
describes this uncertainty so that it's possible to
conclude that one treatment was superior to another. A standard
comparison of means overlooks the fact that, typically, a large chunk of the
variation in the means is in fact predictable. Consider an experiment on users,
where the metric of interest is time spent in the app. Across users, the amount
of time spent in the app over consecutive weeks is usually fairly highly correlated.
This means that a user who spends three hours a day in the app this week is
likely to spend a sizable amount of time in the app next week as well.
Experimental studies often apply covariate or regression adjustment to reduce the variance
and increase the precision.
Deng et al (2013) popularized covariate adjustment in online experimentation.
Their method is commonly referred to as CUPED.
For the adjustment approach to be valid, the experiment must not influence the data used for the adjustment.
In online experimentation, such data is often available.
Any data computed before the unit (such as a customer) entered the experiment is valid.
The more strongly the pre-exposure data correlates with the post-exposure outcomes, the larger the reduction in variance.
## Variance Reduction for Comparisons of Means
The variance reduction method implemented in Confidence for comparisons of means is the "full
regression adjustment" estimator discussed by Negi and Wooldridge (2021).
The method is more precise than the original CUPED approach. Negi and Wooldridge propose to:
* Regress $Y$ on $1, X$ separately for treatment and control, where $Y$ is the outcome, and $X$ is the pre-treatment variable.
* Estimate the treatment difference by $\hat{\Delta}_{VR} = (\bar{Y}_1-\bar{Y}_0)+(\bar{X}-\bar{X}_1)\hat{\beta}_1-(\bar{X}-\bar{X}_0)\hat{\beta}_0$,
where $\hat{\beta}_i$ is the estimated slope from the regressions, $\bar{X}_i$ and $\bar{Y}_i$ are the sample means for each group, and $\bar{X}$
is the overall sample mean of $X$.
Confidence reports both the adjusted and unadjusted estimates of the sample
means. The variance-reduced adjusted estimate is
$\bar{Y}_i-\hat{\beta}_i(\bar{X}_i-\bar{X})$ for each group $i$, and the
unadjusted estimate is $\bar{Y}_i$.
In experiments with multiple treatment groups, the control group's
variance-reduced adjusted mean estimate differs between comparisons. This
happens because the overall sample mean of the pre-treatment variable,
$\bar{X}$, uses only the data from the groups involved in the specific
comparison. Depending on which treatment group you are comparing to the control
group, $\bar{X}$ changes. Regardless, the variance-reduced treatment effect
estimate $\hat{\Delta}_{VR}$ is generally a more precise estimate than the
unadjusted estimate, providing a more reliable measure of the treatment's impact
on the metric of interest.
## Variance Reduction for Comparisons of Ratios
The approach for reducing the variance through use of pre-exposure data
resembles the method described in the earlier section when the metric of
interest is a ratio metric. Confidence uses the method described by Jin and Ba
(2023). Let $Y_i$ and $Z_i$ be the values for the numerator and denominator for
unit $i$. For example, $Y_i$ could be the total number of searches for user $i$,
and $Z_i$ their number of sessions. The ratio of interest is the group-level
ratio $\sum_{i=1}^n Y_i/\sum_{i=1}^nZ_i$. A difference in ratios between the
groups estimates the treatment effect:
$$
\hat{\Delta} = \frac{\sum_{i\text { in treatment}}Y_i}{\sum_{i\text { in treatment}}Z_i} - \frac{\sum_{i\text { in control}}Y_i}{\sum_{i\text { in control}}Z_i}
$$
To reduce the variance, Confidence applies regression adjustment separately to
each of the four terms in the expression. Ultimately, this leads to adjusted
estimates of the ratios in the two groups and a new estimate of the treatment
effect. The adjustment reduces the variance of the ratios of the two groups, and
the uncertainty surrounding the treatment effect is lower.
## Variance Reduction Rate
Variance reduction adjusts the comparison and reduces the variance as a result.
Ultimately, the variance reduction rate summarizes the size of the reduction:
$$
\text{Variance reduction rate} = 1 - \frac{\text{variance with variance reduction}}{\text{variance without variance reduction}}.
$$
## Relative Values
When using variance reduction, reported relative values use the unadjusted
estimates in the denominator. For a comparison of means, the reported relative
value is $\hat{\Delta}_{VR}/\bar{Y}_0$.
## Interpret Results with Variance Reduction
Interpret the reported treatment effect for a metric that uses variance
reduction in the same way as for a metric that doesn't. The pre-exposure data
helps produce a better signal of the treatment effect. Because the
variance-reduced treatment effect differs from the unadjusted treatment effect,
it can occasionally lead to a different conclusion than the unadjusted effect.
## Use Variance Reduction
Confidence enables variance reduction by default.
To turn on variance reduction for a metric:
1. Go to Confidence and select **Metrics** on the left sidebar.
2. Select the metric you want to enable variance reduction for and click **Edit metric**, or [create a new metric](../metrics#create-a-metric).
3. Expand **Advanced options**.
4. Ensure that **Variance reduction** is checked.
5. Optional. Select an aggregation window for the pre-exposure data.
The metric uses the same measurement, but before exposure, to reduce the variance. Variance reduction is accounted for
in the required sample size calculation by relying on historical patterns of how much the variance can be reduced.
To configure variance reduction via the API, see [Configure Variance Reduction](/docs/api/how-to-guides/stats/configure-variance-reduction).
## References
* A. Deng, Y. Xu, R. Kohavi and T. Walker (2013) "Improving the sensitivity of online controlled
experiments by utilizing pre-experiment data," WSDM '13: Proceedings of the sixth ACM international
conference on Web search and data mining.
* Y. Jin and S. Ba (2023) "Toward Optimal Variance Reduction in Online Controlled Experiments."
Technometrics.
* A. Negi and J. M. Wooldridge (2021) "Revisiting regression adjustment in
experiments with heterogeneous treatment effects", Econometric Reviews.
## Related Resources
Configure variance reduction settings
Understand test types
Configure experiment parameters